
Nubart Team
Museum visitor analytics: why QR-code audio guides give museums better audience data than apps or devices
Most museums know how many tickets they sold yesterday. Far fewer know which languages visitors actually used, which exhibits they skipped, or where international visitors came from.
Every audio guide technology produces some data. But not the same data, and not with the same completeness. Understanding the difference matters because for a museum director, the wrong kind of data is not just incomplete. It is invisible in a way that looks like information.
What is museum visitor analytics?
Museum visitor analytics is the collection and analysis of data about museum audiences and their behaviour during and around a visit. It helps museums understand who their visitors are, where they come from, which languages they speak, how they engage with exhibitions, and how long they spend in different parts of the museum. The goal of museum visitor analytics is not commercial conversion, but institutional understanding: improving the visitor experience, planning multilingual content, evaluating exhibitions, supporting funding applications, and demonstrating cultural impact.
The metrics used in museum visitor analytics generally fall into three categories. Audience metrics describe who the visitors are, including their country of origin, language, and visitor type. Behavioural metrics describe what they do during the visit, such as which exhibits they engage with and in what sequence. Engagement metrics describe the depth of the visit itself, including dwell time, repeat visits, and continued interaction with museum content after the visit has ended.
Unlike many forms of digital analytics, museum visitor analytics operates under unusually strict privacy expectations. Museums need meaningful audience intelligence while preserving visitor anonymity — making the balance between data quality and privacy protection a defining constraint of any analytics approach, not an afterthought.
The visitor, or the visit, but rarely both
Museums have always gathered some visitor data. Ticketing systems record footfall, peak hours, and — where pricing tiers exist — broad visitor categories such as adults, concessions, or group bookings. Exit surveys and visitor books capture qualitative impressions from the fraction of visitors willing to stop and respond. Both methods have real value. But they share a structural ceiling: ticketing tells you that someone came, and surveys tell you what a self-selected minority thought. Neither reliably tells you who the audience actually is, what happened during the visit, or which parts of the collection held their attention. It is possible to run a museum for decades on ticket counts and occasional survey reports and still know remarkably little about the people walking through the door.
Over the past decade, digital visitor technologies have started to close these gaps. Among them, audio guides occupy a particularly unusual position because they accompany visitors throughout the visit itself. Yet not all audio guide technologies capture the same information, or with the same completeness.
The audio guide landscape today comprises three distinct approaches: hardware devices, native apps, and web-based guides. Each has real strengths. But when it comes to audience intelligence, each also has a structural blind spot, and only one of them covers both dimensions a museum actually needs.
Most audio guide technologies know only half the story
Hardware devices
Know the visit
Know the visitor
Native apps
Know the visitor
Know the visit
QR-code audio guides
Know the visitor
Know the visit
Knows both.
Hardware devices, the dedicated players handed out at the ticket desk, can tell you something about how the guide was used. Smarter devices log which tracks were played, in what order, and for how long. This is genuinely useful operational data. What a device cannot tell you is anything about the person holding it: where they come from, what language they speak at home, whether they have visited before. The device is anonymous by design. It knows about the visit, but nothing about the visitor.
Native apps, those downloaded from the App Store or Google Play, invert the problem. Both Apple's App Store Connect and Google Play Console provide developers with aggregated data about their users: account country, language preference, device type. This tells you something about who downloaded the app. What it cannot reliably tell you is what happened during the visit itself. App store analytics are built for the acquisition funnel, tracking how users discover and install apps. In-visit behaviour (which exhibits were engaged with, how long someone stayed, which audio content they listened to) is not captured by the app store. To measure it, a developer must build and instrument their own analytics layer on top of the app, a significant additional investment that most museum app providers have not made. On iOS, behavioural tracking increasingly depends on explicit user consent through Apple's App Tracking Transparency framework, and many visitors decline. The result is a dataset with gaps precisely where the museum needs it most.
There is also a structural reason why rich in-app analytics are rare: the economics of native app development work against them. Each museum typically wants its own branded app, with its own listing in the App Store and Google Play, its own review and update cycles. A provider serving fifty museums manages fifty separate app distributions. Building a sophisticated shared analytics backend on top of that operational complexity is a substantial investment that the per-museum native app model rarely supports. This is not a criticism of those providers; it is simply a consequence of their architecture.
A web-based audio guide, technically a Progressive Web App, or PWA, accessed by scanning a QR code, is the only approach that covers both dimensions simultaneously. Because the visitor is using their own mobile browser rather than a downloaded app or a borrowed device, the browser itself becomes a passive source of rich, anonymous data about both the person and the visit. No registration. No permissions dialogue. No invasive tracking layer required.
What the browser already knows
When a visitor scans a QR code and opens the guide in their mobile browser, they are loading a web application. Web browsers, by design, expose a set of signals that can be read server-side automatically as part of every standard web request.
The most important of these for museums is the locale, which includes language and country. A visitor's browser is configured in their native language and country: de-AT for an Austrian German speaker, ja-JP for a Japanese visitor, fr-BE for a French-speaking Belgian. This information is transmitted automatically as part of the standard web protocol, without requiring the visitor to fill in forms, create an account, or answer demographic questions.
Beyond language and origin, the browser makes it possible to calculate dwell time, the interval between a visitor's first and last interaction with the guide during a session. This provides a meaningful proxy for time actually spent in the museum. Nubart does not store or use IP addresses. The signals used are anonymous and aggregated from the moment of collection.
For museums, this creates something that traditional audio-guide technologies rarely achieve: meaningful audience intelligence without requiring visitors to surrender their anonymity.
First-party data, owned by the museum
For museums operating under GDPR, visitor analytics are not only a technical question. They are also a question of governance: who owns the data, who processes it, and where it ultimately resides.
Many museums rely on third-party analytics platforms to understand their digital audience. Even when those platforms are GDPR-compliant by design, the data relationship still runs through an external vendor: their servers, their terms of service, their data retention policies, and their potential future changes. For museums accountable to public authorities, trustees, funding bodies, or cultural ministries, that dependency deserves careful scrutiny. It is worth noting, too, that many mainstream analytics platforms were originally designed for advertising and marketing optimisation rather than for cultural institutions handling anonymous public audiences. The institutional fit has always been imperfect.
With native apps, there is an additional wrinkle specific to data sovereignty. Whatever analytics the app store provides, download counts, territory breakdowns, retention signals, lives in Apple's App Store Connect or Google's Play Console, in the developer's account. The museum is effectively a guest in the developer's data environment rather than the owner of it. If the museum changes provider or the relationship ends, access to that historical data goes with it.
This is why Nubart chose to develop and operate its statistical infrastructure entirely in-house. No third-party analytics platform touches the data. Because the system does not rely on third-party cookies or external tracking scripts, the data is also unaffected by the privacy tools that increasingly block conventional analytics, including browsers like Brave or Safari's Intelligent Tracking Prevention. What the museum sees in their dashboard is a first-party analytics relationship rather than a dependency on a third-party advertising ecosystem: collected on their behalf, processed on their behalf, and not shared with or sold to anyone.
The result is not only stronger visitor privacy, but also institutional continuity. The museum retains a stable, uninterrupted relationship with its own audience intelligence over time.
From visitor behaviour to institutional insight
Traditional museum analytics usually separate digital behaviour from physical behaviour. Browser-based audio guides connect the two. The statistics dashboard is available to all Nubart GUIDE customers from the first day of deployment and is included as standard; there is no paid analytics tier.
The data covers both dimensions established earlier: who the visitor is, and what actually happened during their visit.
On the visitor side:
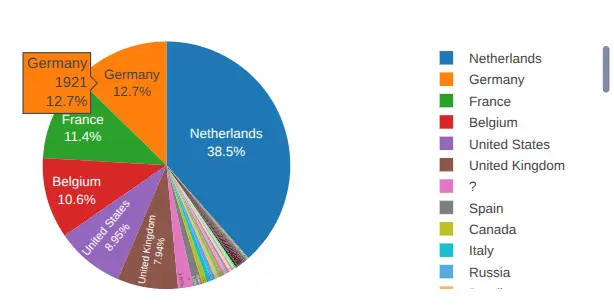
- Country of origin reveals whether a museum's actual audience matches its tourism assumptions, and whether specific translations, partnerships, or outreach campaigns are justified.
- Native language is tracked independently from country patterns, allowing museums to distinguish between international tourists and multilingual local communities. A museum in Berlin seeing high English-language usage might assume an American tourist audience. Country-of-origin data may reveal instead a large local expat community, a very different audience requiring very different outreach. This allows museums to distinguish between the tourist and the neighbour, ensuring local engagement is as data-driven as international marketing.
- Devices used provides the technical profile (operating system and browser) needed for future digital planning and accessibility work.
- Total number of visitors using the audio guide.
On the visit side:
- Time spent in the museum is calculated from the interval between a visitor's first and last interaction, with configurable session parameters to calibrate accurately across different space sizes and layouts.
- Audio tracks listened to reveal which content visitors actually engaged with, and which they skipped.
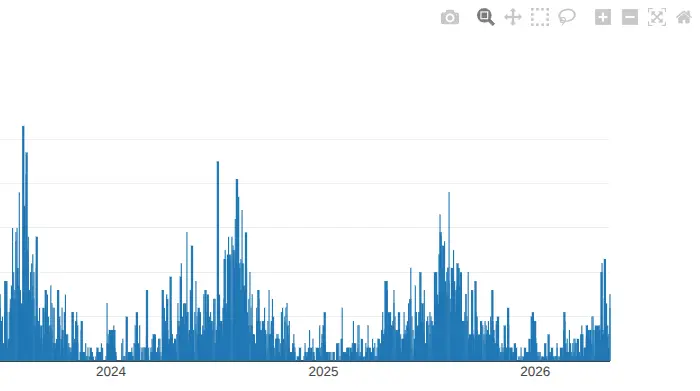
- Usage by time of day and day of week supports staffing decisions, programming, and temporary exhibition scheduling.
- Activity broken down by country and language connects audience origin to actual guide usage patterns.
Where a museum's audio guide has a modular structure, with separate modules for different floors, wings, or temporary exhibitions, each module has its own dedicated statistics. A museum with three floors gets three independent datasets, not one blended report.
A dashboard built for institutional use, not just monitoring
Data is only useful if it can be explored and acted upon. Nubart's dashboard is interactive, allowing filtering by specific seasons or temporary exhibition dates, toggling individual values to compare year-on-year growth, or isolating specific language or country groups for closer analysis. Most importantly, this is not a walled garden. Every chart can be downloaded as a PNG for inclusion in board reports, grant applications, or press materials, and selected datasets can be exported as CSV for integration with the museum's own reporting or CRM tools. The analytics become organisational infrastructure rather than merely dashboard visuals.
The dwell time chart allows the session interval and usage threshold to be configured before reloading, which is useful for calibrating calculations to the specific geometry of a particular venue.
Optional: geotracking and visitor movement heatmaps
It is important to state clearly at the outset: geotracking is an optional, explicitly consent-based feature, and fundamentally different from the covert location tracking associated with retail analytics. When a visitor opens the audio guide, a standard browser prompt asks whether they are willing to share their location. Those who decline simply use the guide normally, without contributing any location data. Nothing is collected passively or without awareness.
For venues where this opt-in is offered, visitor movements through the space are recorded as GPS track points and aggregated into a heatmap overlaid on a map of the venue. This takes the anonymous physical visit to its logical conclusion: a museum can learn which galleries consistently hold visitors longest, which rooms are frequently bypassed, and where natural bottlenecks form. By visualising bottlenecks and undervisited areas, museums can optimise their physical layout and temporary exhibition flow based on real-world movement data. These are insights that are extremely difficult to obtain from traditional device-rental systems or ticketing data alone. This kind of spatial analysis has historically required costly observational research; a browser-based audio guide makes it a by-product of the visit itself.
The raw track point data can also be exported as CSV for more granular spatial analysis. Geotracking is available as a paid add-on; the core statistics dashboard described above is included as standard for all customers.
A note on data quality: three formats, three levels of confidence
In visitor analytics, the quality of the conclusions depends not only on what is measured, but also on how visitors access the guide in the first place. Nubart GUIDE is available in three access formats, each producing a different level of confidence about whether the recorded audience corresponds to the physical audience actually present in the museum.
| Access format | Precision level | Main strength | Main limitation |
|---|---|---|---|
| Non-transferable physical cards | Highest | Strongest correspondence between guide use and physical visit | Requires on-site distribution |
| Unique digital codes (via API / e-ticketing) | Very high | Supports e-ticketing integration and pre-visit engagement | First session may occur before physical arrival |
| Generic QR code | Moderate | Lowest friction and easiest deployment | Public sharing can distort audience attribution |
Physical non-transferable cards, issued at the entrance at the moment of visit, offer the highest evidentiary confidence. Each card carries a unique code handed to a single visitor on site. One token equals one visit, and the gap between code activation and physical presence in the museum is essentially zero. This is Nubart's most popular format, used by the large majority of customers.
Digital unique codes, delivered via API integration with e-ticketing platforms or online shops, share the same one-token-one-visitor precision as physical cards and are equally non-transferable. The one nuance is that a visitor who purchases a ticket online may access the audio guide at home before their visit, meaning their first recorded session may predate their physical arrival at the museum. While early access may shift dwell-time stats for that session, it also provides a unique window into the visitor journey before they even step through the doors and does not distort audience data such as country of origin or native language. Interestingly, a visitor who accesses the guide at home and again on-site will appear as a returning user, a signal of pre-visit engagement that is itself meaningful. The resulting dataset still carries a level of one-token-one-visit precision that open QR deployments cannot fully replicate.
Generic QR codes, a single open code displayed on signage or printed on tickets, remain a powerful tool for low-friction access, providing valuable directional trends even if they lack the evidentiary precision of unique tokens. Because the link can in principle be shared publicly, not all recorded users are necessarily on-site visitors, and audience data cannot be attributed to the physical museum audience with the same confidence as the non-transferable formats.
For museums where visitor analytics inform funding applications, multilingual strategy, accessibility planning, or institutional reporting, the non-transferable formats provide a level of evidentiary rigour that open QR deployments cannot fully guarantee.
One metric worth a separate conversation: returning visitors
There is one further capability in Nubart's dashboard that deserves mention here, even though it merits its own dedicated article: returning users. These are visitors who access the audio guide again more than 24 hours after their last interaction, people who come back to the museum, or who return to the guide from home, days or weeks after their visit.
No hardware device and no native app can measure this without user accounts. Nubart can, because the non-transferable card acts as a persistent but anonymous identifier. For museums that position their audio guide as something visitors keep, a lasting companion to the collection rather than a disposable rental, this metric is a direct measure of that ongoing relationship. We will explore it in a dedicated article shortly.
What this means in practice
Consider what a museum director actually needs to know to do their job well. They need to make the case for funding: who is the audience? They need to plan multilingual content: which languages matter? They need to evaluate an exhibition: how long did people stay? They need to justify a marketing spend: which origin countries are growing?
None of these questions can be answered by counting tickets or tracking device rentals. They require structured, reliable, first-party audience data, the kind that a browser-based audio guide produces as a natural by-product of every visit, without inconveniencing the visitor, without registration, and without compromising anyone's privacy.
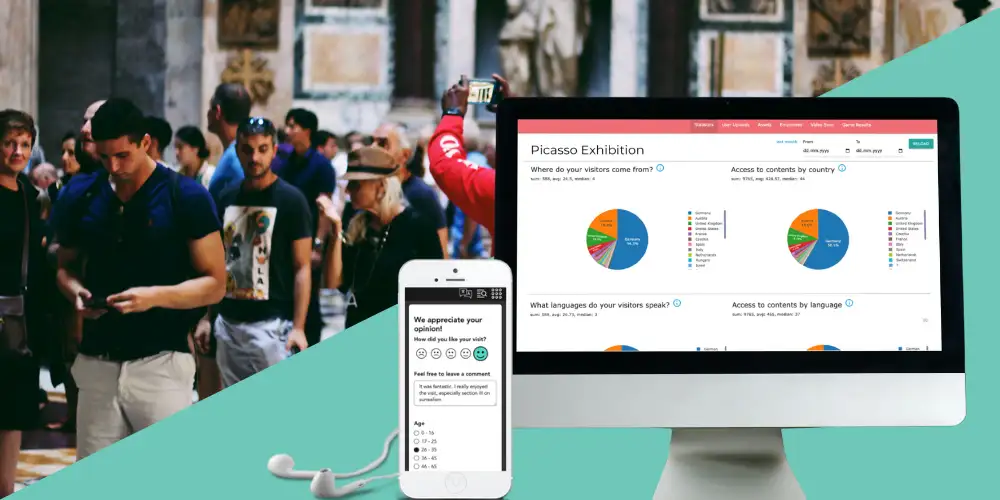
Nubart GUIDE turns an anonymous physical visit into measurable, privacy-friendly audience intelligence. The audio guide is the service visitors experience. The data is what the museum takes home.
Nubart also offers an embedded feedback form that appears at the end of the audio guide, a separate but complementary tool for collecting qualitative visitor opinions. We cover it in detail in this article.