
Dr. Rosa Sala
The Reality Check: How Museum Audio Guide Apps Are Failing to Reach Visitors
After analyzing 175 official museum audio guide apps across Europe and the United States, we discovered a startling reality: only 2.47% of museum visitors actually download and use these native applications. This finding challenges the widespread assumption that smartphone apps are the natural solution for modern museum experiences.
Contents of this article
- Museum audio guide apps: A data-driven wake-up call for cultural institutions
- Methodology and findings: How we calculated a 2.47% adoption rate
- The exception that proves the rule
- Conclusion
Museum audio guide apps: A Data-Driven Wake-Up Call for Cultural Institutions
At Nubart, we have been gathering information about native audio guide apps for museums and monuments and analysing them internally for years. When we first started seeing the numbers referenced in this article, we thought we had made a calculation error.
Many museums continue to invest considerable sums in the development and maintenance of apps for iOS and Android. However, the reality does not reflect these efforts. Yes, most visitors carry smartphones —over 90%, in fact— but hardly any of them actually download or use museum-specific apps. We are referring to “native” apps that can be downloaded from the App Store or Google Play.
This article presents what is, to our knowledge, the first data-driven look at how museum apps are really performing. By combining late nights crunching numbers and publicly available app store data with official visitor statistics, we’ve built a picture—imperfect but revealing—of just how low adoption rates actually are.
And the numbers are striking. Despite the high costs of developing and maintaining these apps—often running into the tens of thousands of euros each year—museums are typically reaching fewer than 4% of their visitors through them.
That’s a serious mismatch between effort and outcome.
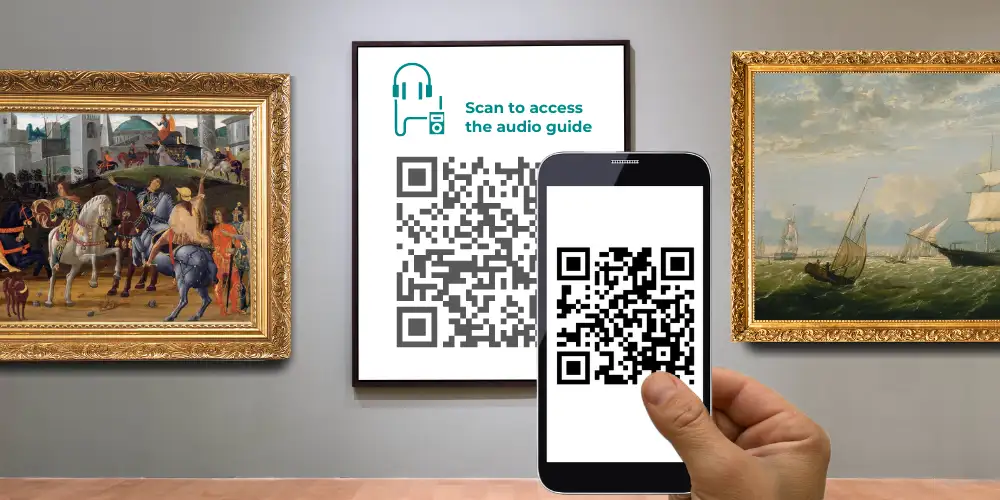
Meanwhile, more lightweight solutions, like progressive web apps (PWAs) accessed via QR codes, are proving far more visitor-friendly. They don’t require downloads or installations, and they work instantly across all devices. Advanced implementations can even operate in offline mode, solving connectivity problems in venues with thick stone walls, underground galleries, or poor mobile signal — without forcing visitors to download anything in advance.
For museum professionals, cultural institutions, and tech providers alike, these findings should prompt a serious rethink: Are we really meeting visitors where they are?
Methodology and Findings: How We Calculated a 2.47% Adoption Rate
1. Defining the sample
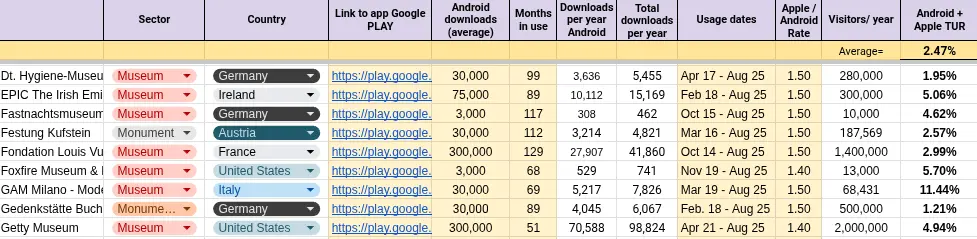
We analyzed 175 official museum and monument audio guide apps available on Google Play across Europe and the United States. Third-party, unofficial apps were excluded to ensure consistency with institutional offerings.
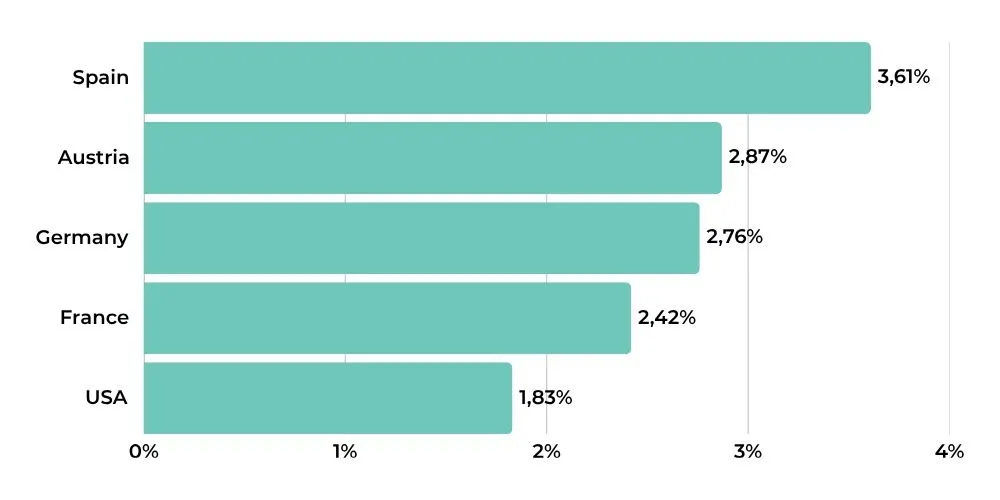
Our dataset reflects a concentration of museums from Spain, USA, France, Austria and Germany, where we have been systematically collecting this data over several years.
We excluded audio guides integrated into broader museum platform-apps, such as Bloomberg Connects, promoted by Bloomberg Philanthropies, as it is not possible to attribute a specific number of downloads to each museum. However, it can be assumed that the adoption rate of these platform apps is even lower, as they add an extra step to the process of downloading an app: finding the museum within the app itself.
We only included apps that were currently active—any that had been removed or marked inactive were excluded from the analysis.
2. Tracking Android Downloads
Google Play doesn’t provide exact download numbers. Instead, it shows broad ranges like “1+”, “5+”, “10+”, "50+”, “100+”, “500+”, and so on.
To get closer to the actual figures, we estimated the number of downloads by using the midpoints of each range. For example, if an app showed “100+” downloads, we counted it as 300. “500+” became 750, and “50,000+” as 75,000.
Using midpoints, of course, introduces a margin of error. However, when we tested our method on a random sample using both the upper and lower bounds, the variation in adoption rates was minimal — less than ±0.3 percentage points. With a large dataset of 175 apps, this variation is averaged out even further.
We excluded apps with more than 300,000 downloads from our study, as the range became too unpredictable at such high numbers. (In any case, we only found one audio guide app that exceeded this figure: the Sagrada Família app in Barcelona. This is a special case, as the app serves as both a ticket storage platform and an audio guide).
It's important to note that download counts include users who briefly installed the app and then deleted it. Google Play’s public figures represent the total number of installations, regardless of whether the app was later uninstalled. They also include users who downloaded the app but never opened it. Therefore, the 2.47% adoption rate we calculated reflects the percentage of visitors who made an attempt to try the app at some point—not those who still have it installed today. Given these circumstances, it's reasonable to assume that actual usage is even lower.
3. Normalizing by time in market
To factor in how long each app had been available, we recorded its publication date and calculated how many months it had been on the market as of August 2025.
This allowed us to estimate average annual downloads, making it easier to compare newly launched apps with those that had been around for years.
By normalizing downloads to a yearly rate, we also reduced the impact of early surges or later declines, resulting in a more balanced comparison across very different types of apps.
4. Incorporating visitor statistics
We gathered annual visitor numbers from trustworthy public sources, such as official museum reports and national or regional tourism boards. Unfortunately, it is not always possible to find reliable data on visitor numbers, which has forced us to exclude from our study the apps of those museums whose data we were unable to obtain.
When data from multiple years were available, we took the average of the years the app has been in use. This helped smooth out unusual spikes or dips in attendance, like those caused by blockbuster exhibitions or temporary closures.
5. Estimating iOS downloads
Unlike Android, iOS doesn’t make app download numbers publicly available. To account for iPhone users, we applied correction factors based on regional mobile operating system market shares.
For example, in Europe, Android holds about 70% of the market and iOS around 30%. That gives us a correction factor of 1.5×. So if a European museum app shows 1,000 Android downloads, we estimate it actually reached around 1,500 users in total, including iOS.
In the United States, where iOS has a stronger presence (about 59% compared to Android’s 41%) we applied a slightly lower correction factor of 1.4×.
These multipliers are based on the most recent mobile OS statistics for 2024–2025, taken from sources like StatCounter and Backlinko. By using up-to-date, region-specific data, we aimed to reflect real-world user distributions as accurately as possible.
6. Calculating the adoption rate
To estimate how many museum visitors actually downloaded an app, we followed a simple three-step process for each case:
- We started by multiplying the app’s annual Android downloads by the appropriate regional correction factor (to account for iOS users).
- Then, we divided that total estimated number of downloads by the museum’s annual visitor count.
- Finally, we converted the result into a percentage.
After applying this method across all 175 apps in our dataset, the average adoption rate came out to just 2.47%. In other words, on average, only a little over 2% of visitors actually download a museum’s native audio guide app.
The Exception That Proves the Rule
Among all the apps we reviewed, one clear outlier stood out: the Museum Barberini in Potsdam, which achieved an impressive 20.76% adoption rate, almost 6 porcentual points ahead of the second most downloaded app in our analysis, Taliesin West in Arizona. But rather than undermining our findings, this exception actually highlights just how much effort—and money—is required to make a museum app truly successful.
Backed by SAP co-founder Hasso Plattner, the Barberini app had access to virtually unlimited technical resources. The result is more than just an app; it's a full digital ecosystem. It features award-winning design, integrated ticketing, advanced indoor navigation via beacons, AI-generated soundscapes, and a robust dual-server infrastructure.
Despite all of that, the app still reached only about one in five visitors.
For most museums working with standard budgets and limited technical staff, Barberini’s 20.76% adoption rate isn’t a realistic target—it’s a ceiling. And it only reinforces the main takeaway: native apps remain a tough sell, even under the best possible conditions.
Conclusion
While this may be the most comprehensive look at museum app adoption to date, it’s not without its limitations. Our sample focuses mainly on institutions in Western Europe and North America. We also excluded integrated apps where attribution wasn’t possible, and we weren’t able to measure true usage beyond initial downloads. Still, with 175 diverse institutions represented, the consistent pattern we observed likely reflects broader industry realities.
For a sector rooted in public access and education, a 2.47% adoption rate isn’t just underwhelming—it points to a serious misallocation of resources. The way forward may not lie in building better apps, but in better understanding visitor behavior.
Museums are experts at removing obstacles to cultural experiences. But in the digital realm, many have unintentionally put one of the biggest obstacles in the way: requiring a download. The institutions with higher digital engagement are showing that sometimes, the best app is no app at all.
We plan to update this analysis regularly as the dataset grows, and we welcome museum professionals to contribute their own cases or insights.
We hope you found this article useful. Subscribe to our newsletter so you don't miss any of our posts.
You may also be interested in
Guide to implement a PWA as an audio guide in a museum
Thinking of implementing a web application as an audio guide for your museum? Here is a comprehensive guide with all you need to know: CMS, business models, and more.
How to improve the visitor experience with QR codes in museums
After Covid, QR codes are more popular than ever! Don't miss the opportunity to make the most of them in your museum.